|
<< Click to Display Table of Contents >> Forms with two tables |
  
|
|
<< Click to Display Table of Contents >> Forms with two tables |
  
|
Some lists with few columns will be so narrow that only part of the width of the available area within the drawing frame is utilised. This could for example be the case for a simple cable list, like the one shown in the figure below.
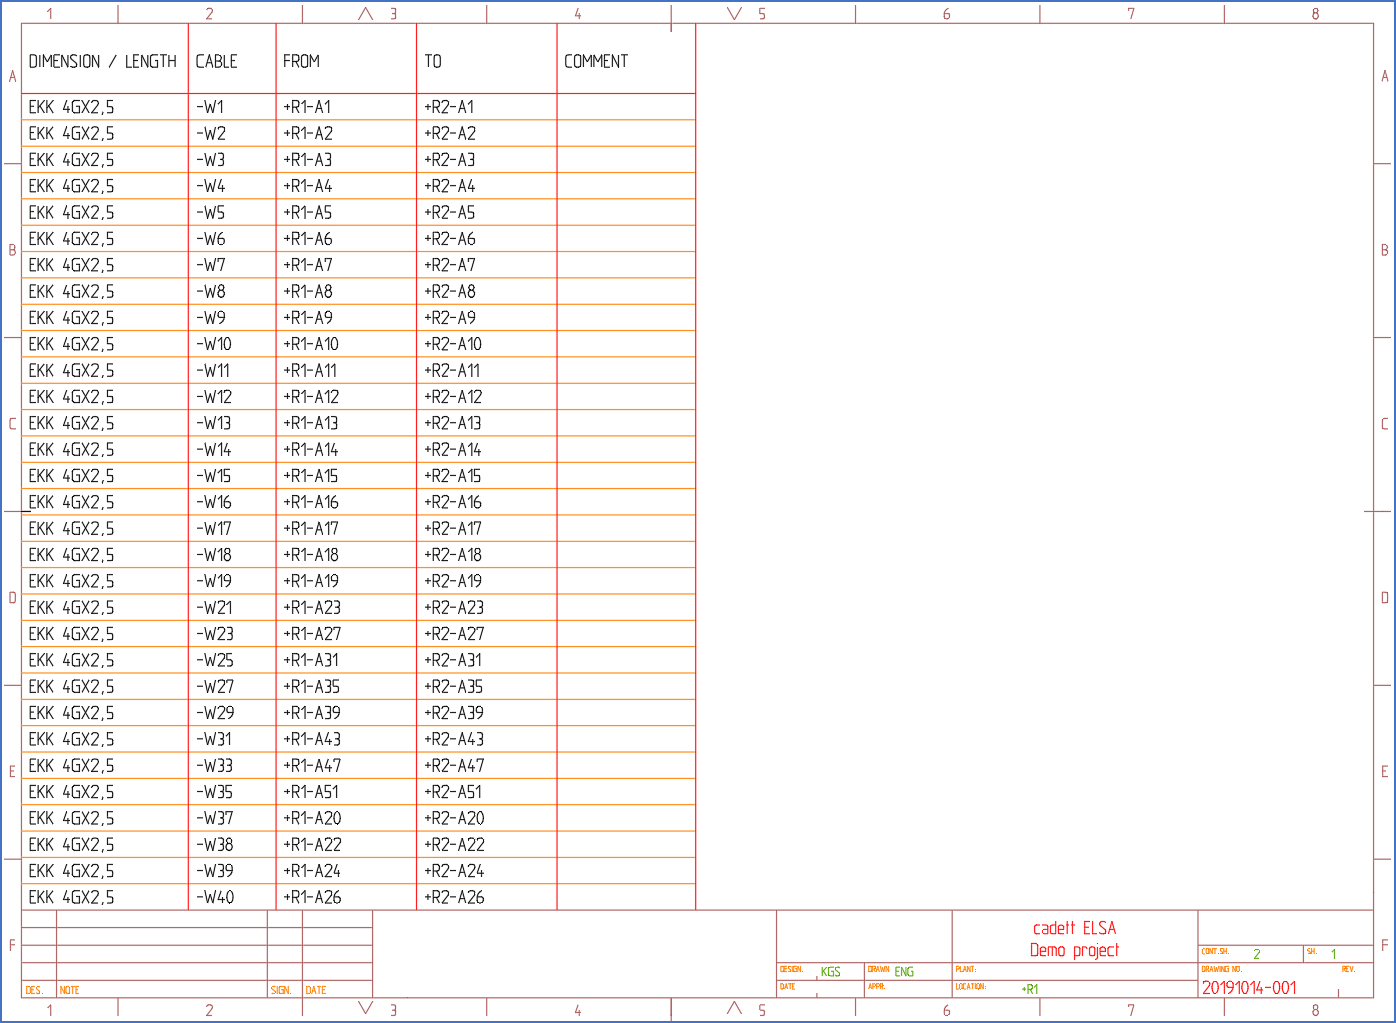
Figure 1708: A simple cable list where a lot of space within the drawing frame has not been utilised at all.
To reduce the total number of sheets needed for the report, it could then be tempting to place two tables next to each other, as in the extended DXF form that is shown in the figure below.
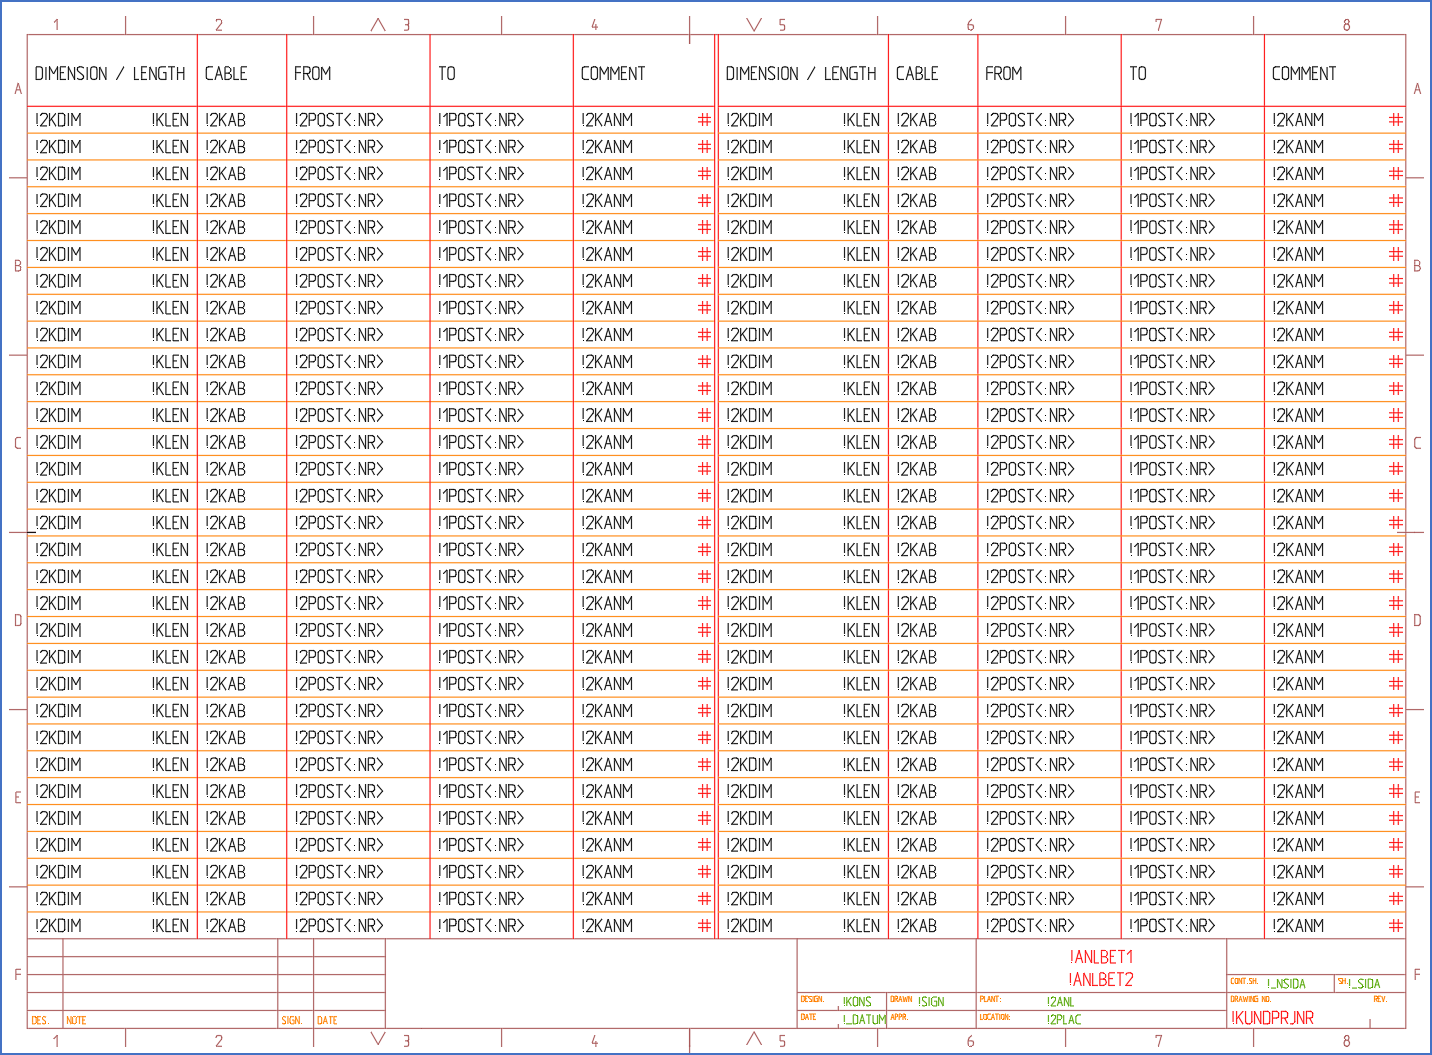
Figure 1709: In this extended form, a second table has been added to the right, thereby better utilising the available space.
However, if you create a DXF form like the one shown above, prepare it as a horizontal form, and generate the report again, the result will not be the expected, or at least not the desired. Please refer to the figure below, which shows the result.
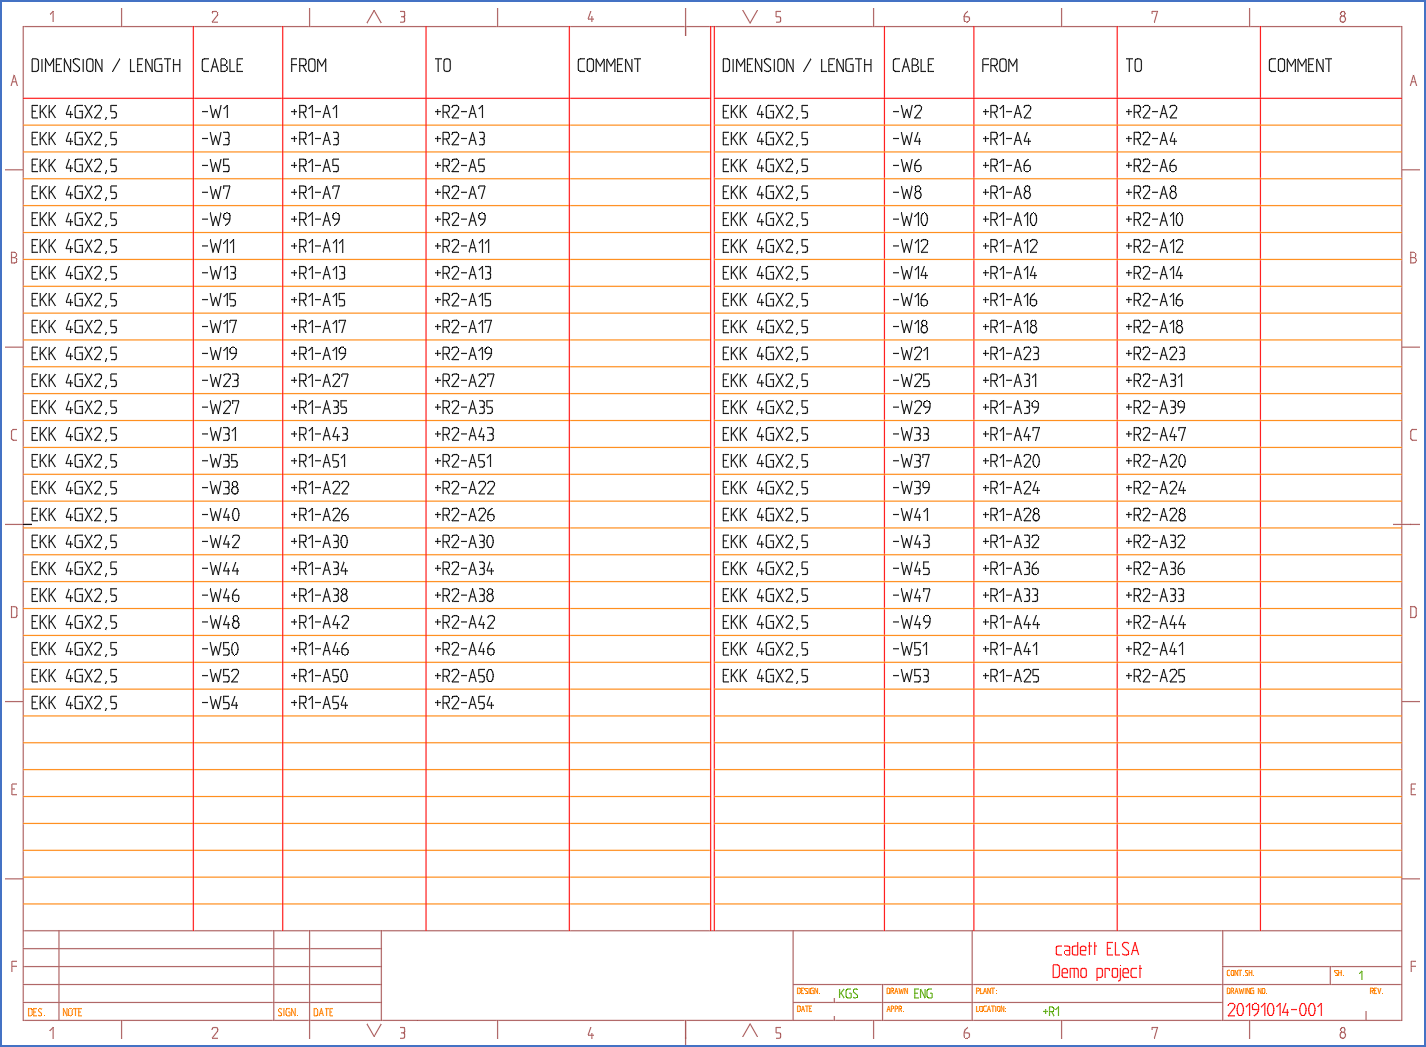
Figure 1710: The sequence between the rows is not the desired one here.
The result will be as shown above, for reasons that are obvious as soon as you start thinking about it. The variables are sorted from above and downwards, and from left to right. Therefore we will have -W1 in the top left, -W2 in the top right, and so on.
So, how can we solve this problem, and get the drawing sheets in the desired order?
The solution is to move all variables of the first (left) table and place them above all other variables, before the preparation is made. Then, you move them back. In that way, all rows of the first table, will come first, and all rows of the second table, thereafter.
First, you move all variables from the first table - the one to left - upwards, so that they are placed above all other variables, like shown in the figure below.
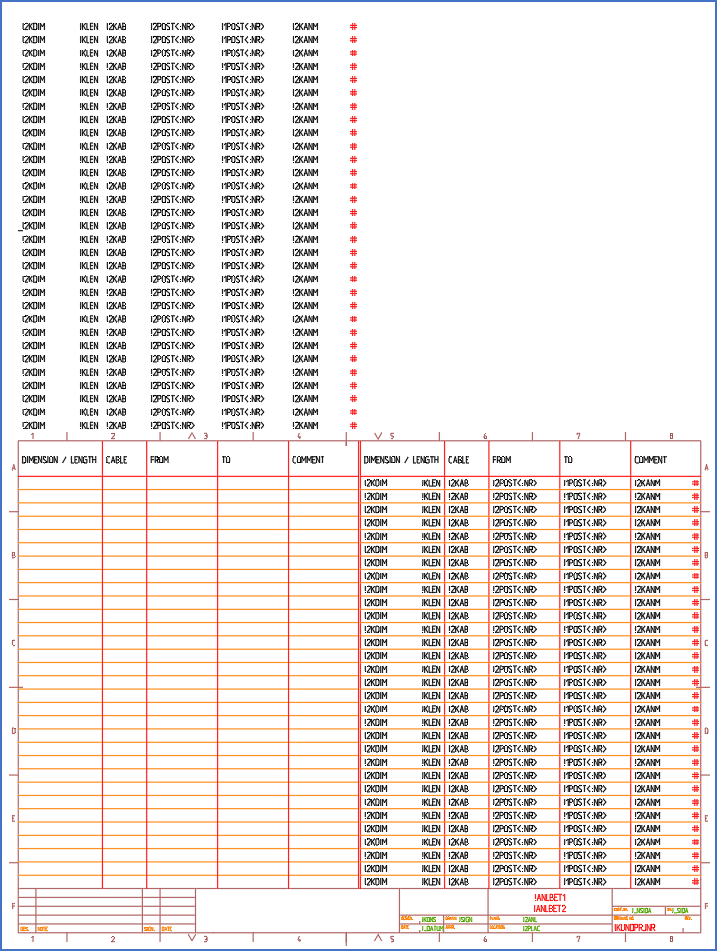
Figure 1711: By moving the variables of the first table upwards before preparing the form, a more logic sequence is accomplished. Please do not forget to move the variables back to their original positions afterwards.
The, prepare the form as an ordinary horizontal form. Thereafter, move all variables back to their original positions.
Generate the report once again, and the result will be as shown in the figure below.
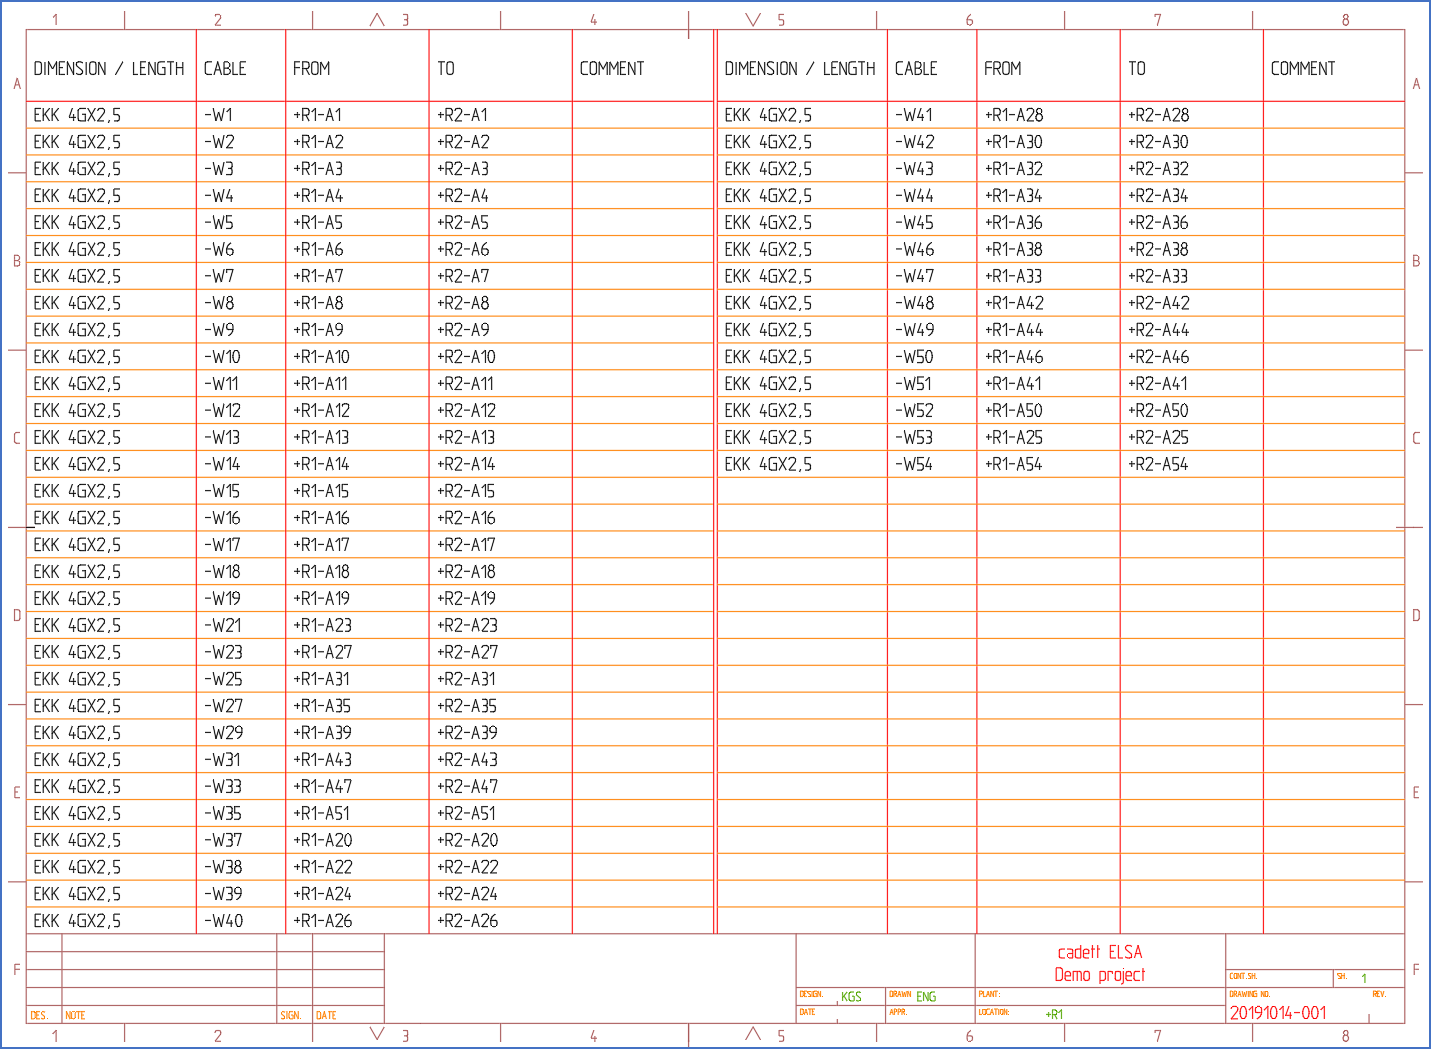
Figure 1712: Now, the sequence is as it should be.